Skip to content

Chapter 20

IIR filter design

Six lessons in Part VII, Filter design. Read them in order, or start anywhere: a prerequisite is a link, never a gate.

Start with 20.1
0 of 6 read3 on the essential pathabout 115 minutes

Lessons in this chapter

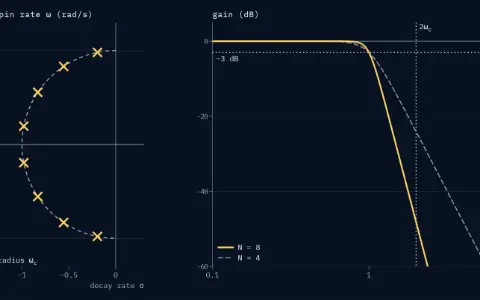
Two panels. The s-plane, decay rate σ from −1.3 to 0.3 and spin rate ω from −1.3 to 1.3 rad/s: a dashed half-circle of radius ω_c = 1 rad/s, and eight poles (×) on it, 22.5° apart. Gain in dB against ω from 0.1 to 10 rad/s on a log scale: the order-8 Butterworth curve, solid, at −48.16 dB on the dotted vertical at 2 rad/s; the order-4 curve faint and dashed. A dotted level marks −3 dB, and every curve crosses it at 1 rad/s.Two panels. The s-plane, decay rate σ from −1.3 to 0.3 and spin rate ω from −1.3 to 1.3 rad/s: a dashed half-circle of radius ω_c = 1 rad/s, and eight poles (×) on it, 22.5° apart. Gain in dB against ω from 0.1 to 10 rad/s on a log scale: the order-8 Butterworth curve, solid, at −48.16 dB on the dotted vertical at 2 rad/s; the order-4 curve faint and dashed. A dotted level marks −3 dB, and every curve crosses it at 1 rad/s.

Lesson 1 Essential20 minYou are hereRead

Analog prototype filters

Butterworth, Chebyshev, elliptic and Bessel filters, where each puts its poles, what each trades, and the order each needs for a spec.

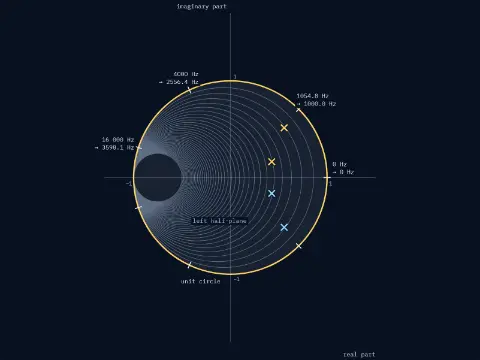
One plane, real part from −1.3 to 1.5 and imaginary part from −1.7 to 1.7, one scale both ways, with the thin unit circle drawn as the target. The jω axis now lies on the unit circle. Its ticks landed: 0 Hz at z = 1, 1054.8 Hz at 1000.0 Hz, 4000 Hz at 2556.4 Hz, 16 000 Hz at 3598.1 Hz, with their mirrors below the real axis. The hatched left half-plane fills the inside of the circle. Four poles, crosses, all inside: radius 0.758 at ±42.7° and 0.458 at ±20.9°.One plane, real part from −1.3 to 1.5 and imaginary part from −1.7 to 1.7, one scale both ways, with the thin unit circle drawn as the target. The jω axis now lies on the unit circle. Its ticks landed: 0 Hz at z = 1, 1054.8 Hz at 1000.0 Hz, 4000 Hz at 2556.4 Hz, 16 000 Hz at 3598.1 Hz, with their mirrors below the real axis. The hatched left half-plane fills the inside of the circle. Four poles, crosses, all inside: radius 0.758 at ±42.7° and 0.458 at ±20.9°.

Lesson 2 Essential20 minYou are hereRead

IIR design by the bilinear transform

Map an analog filter to a digital one with the bilinear transform, watch frequencies warp, pre-warp the cutoff, and design a Butterworth by hand.

Time panel, T_s h_c(t) against time from 0 to 1.5 ms: the analog impulse response, a damped sine that rises to 0.358 at 0.18 ms, dips below 0 after 0.71 ms and settles. 12 samples h[n] stand on the curve, one every 0.125 ms: 0, 0.336, 0.328, 0.209, 0.096 and on. Z-plane with the unit circle: two poles at 0.574∠±31.8°.Time panel, T_s h_c(t) against time from 0 to 1.5 ms: the analog impulse response, a damped sine that rises to 0.358 at 0.18 ms, dips below 0 after 0.71 ms and settles. 12 samples h[n] stand on the curve, one every 0.125 ms: 0, 0.336, 0.328, 0.209, 0.096 and on. Z-plane with the unit circle: two poles at 0.574∠±31.8°.

Lesson 315 minYou are hereRead

Impulse invariance

Copy an analog filter by sampling its impulse response. Each pole maps by a simple rule, but the gain folds near half the sample rate.

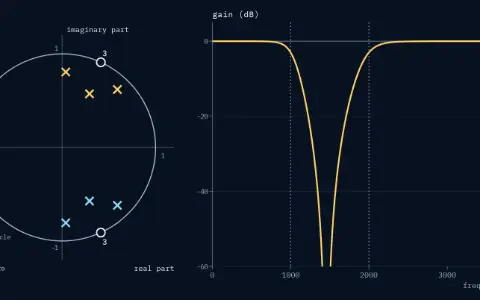
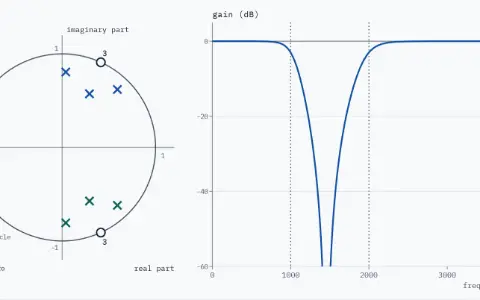
Two panels. Plane: real part and imaginary part from −1.2 to 1.2 with the unit circle. The band-stop has six poles, crosses: 0.8073 at ±87.21°, 0.8560 at ±46.31° and 0.6436 at ±62.93°; and three zeros at each of ±65.5° on the unit circle. Gain: dB from −60 to 5 against frequency from 0 to 4000 Hz, with dotted lines at 1000 and 2000 Hz; the band-stop gain is 0 dB at both ends, −3 dB at 1000 and 2000 Hz, and drops below −60 dB at 1456 Hz.Two panels. Plane: real part and imaginary part from −1.2 to 1.2 with the unit circle. The band-stop has six poles, crosses: 0.8073 at ±87.21°, 0.8560 at ±46.31° and 0.6436 at ±62.93°; and three zeros at each of ±65.5° on the unit circle. Gain: dB from −60 to 5 against frequency from 0 to 4000 Hz, with dotted lines at 1000 and 2000 Hz; the band-stop gain is 0 dB at both ends, −3 dB at 1000 and 2000 Hz, and drops below −60 dB at 1456 Hz.

Lesson 420 minYou are hereRead

Frequency transformations

Turn one low-pass prototype into a high-pass, band-pass or band-stop by substitution, and retune a digital low-pass with one all-pass number.

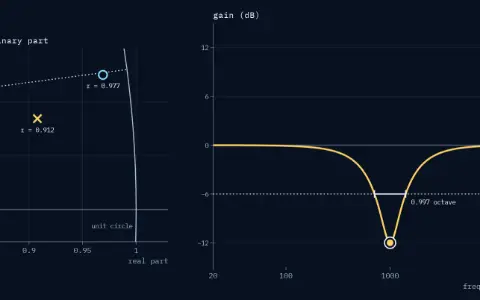
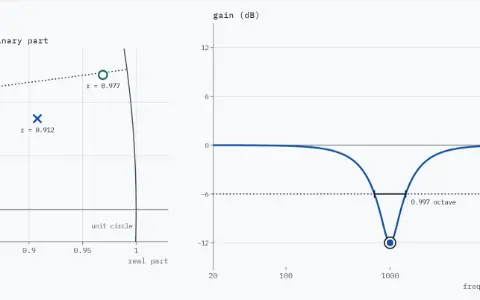
Peaking biquad at −12.0 dB. In the plane near z = 1, the upper pole is at radius 0.912 and 5.33 degrees, the upper zero at radius 0.977 and 7.38 degrees; the 1 kHz ray is at 7.50 degrees. The gain curve, on a log frequency axis from 20 Hz to 20 kHz, has a dip of −12.0 dB at 1 kHz. At half its height, −6.0 dB, it is 0.997 octave wide, from 708 to 1412 Hz. The bottom of the curve is a handle for the gain.Peaking biquad at −12.0 dB. In the plane near z = 1, the upper pole is at radius 0.912 and 5.33 degrees, the upper zero at radius 0.977 and 7.38 degrees; the 1 kHz ray is at 7.50 degrees. The gain curve, on a log frequency axis from 20 Hz to 20 kHz, has a dip of −12.0 dB at 1 kHz. At half its height, −6.0 dB, it is 0.997 octave wide, from 708 to 1412 Hz. The bottom of the curve is a handle for the gain.

Lesson 520 minYou are hereRead

Audio equalisers and biquads

Build audio equalisers from biquads, with cookbook peaking, shelf and notch filters, their poles and zeros, Q in octaves, and cascades whose dB curves add.

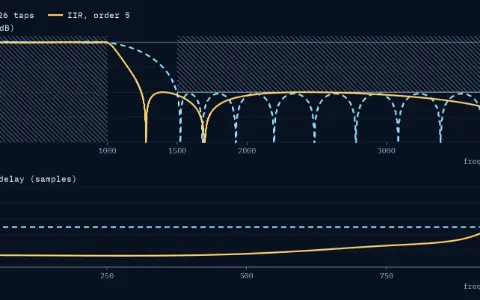
Two stacked panels. Top: gain in dB from 0 to 4000 Hz with the running spec as hatched zones: the pass band up to 1000 Hz within 1 ± 0.05, the stop band from 1500 Hz below −40 dB. Bottom: group delay in samples from 0 to 1000 Hz. FIR, 26 taps (dashed): the gain passes; the delay is 12.5 samples at every frequency. IIR, order 5 (solid): the gain passes; the delay is 3.7 samples at 0 Hz, 3.6 at 250 Hz, 4.2 at 500 Hz and climbs to 23.1 at 1000 Hz. A dotted cursor at 1000 Hz: FIR 12.5, IIR 23.1 samples.Two stacked panels. Top: gain in dB from 0 to 4000 Hz with the running spec as hatched zones: the pass band up to 1000 Hz within 1 ± 0.05, the stop band from 1500 Hz below −40 dB. Bottom: group delay in samples from 0 to 1000 Hz. FIR, 26 taps (dashed): the gain passes; the delay is 12.5 samples at every frequency. IIR, order 5 (solid): the gain passes; the delay is 3.7 samples at 0 Hz, 3.6 at 250 Hz, 4.2 at 500 Hz and climbs to 23.1 at 1000 Hz. A dotted cursor at 1000 Hz: FIR 12.5, IIR 23.1 samples.

Lesson 6 Essential20 minYou are hereRead

Choosing FIR or IIR

Compare FIR and IIR filters for one spec by cost, delay and phase, run a filter forwards and backwards, and choose with a checklist.

After this chapter

Where to go next.

The chapters either side, and the rest of Part VII in the library.

Phasorium
LibraryEvery lesson, in order

Parts

About Phasorium
Look