Skip to content

Chapter 29

Audio and music

Three lessons in Part XI, Applications. Read them in order, or start anywhere: a prerequisite is a link, never a gate.

Start with 29.1
0 of 3 readabout 62 minutes

Lessons in this chapter

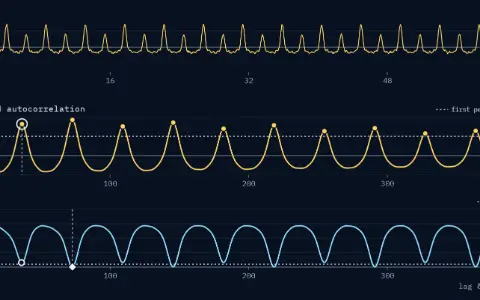
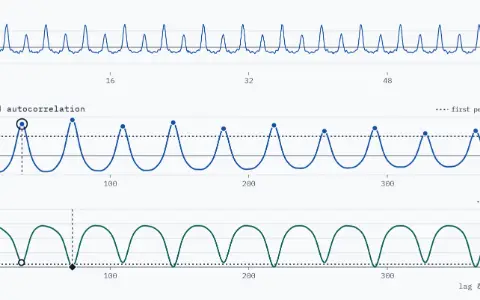
Three stacked panels. Frame: one 64 ms frame of a synthetic 220 Hz note, 1024 samples at 16 kHz, whose even harmonics are strong, between −2.81 and 2.81. Normalised autocorrelation over lags 0 to 400, with a dotted level at 0.5: peaks at lags 36.35 (0.818), 72.72 (0.925), 109.08 (0.758), 145.45 (0.854) and 6 more, lower and lower. The rule takes the first peak above 0.5, at lag 36.35: 440.1 Hz, an octave too high. YIN's normalised difference D′ is 0.156 at lag 36, above the dotted threshold 0.1, and first falls below it at lag 72; the diamond marks the refined dip at lag 72.72: 220.0 Hz.Three stacked panels. Frame: one 64 ms frame of a synthetic 220 Hz note, 1024 samples at 16 kHz, whose even harmonics are strong, between −2.81 and 2.81. Normalised autocorrelation over lags 0 to 400, with a dotted level at 0.5: peaks at lags 36.35 (0.818), 72.72 (0.925), 109.08 (0.758), 145.45 (0.854) and 6 more, lower and lower. The rule takes the first peak above 0.5, at lag 36.35: 440.1 Hz, an octave too high. YIN's normalised difference D′ is 0.156 at lag 36, above the dotted threshold 0.1, and first falls below it at lag 72; the diamond marks the refined dip at lag 72.72: 220.0 Hz.

Lesson 120 minYou are hereRead

Pitch detection

Find a note's period with autocorrelation and YIN, see a strong second harmonic fake an octave, and read the pitch as a note and cents.

Every delay is a comb: y[n] = x[n] + 0.7 x[n − D] at 16 kHz, D = 300 ms (4800 samples). Impulse response: the dry stem, height 1, at 0 ms and the delayed stem, height 0.7, at 300 ms. Gain: 2400 notches below 8 kHz, 3.3 Hz apart, too close to draw, so the gain is a band between −10.5 dB and 4.6 dB.Every delay is a comb: y[n] = x[n] + 0.7 x[n − D] at 16 kHz, D = 300 ms (4800 samples). Impulse response: the dry stem, height 1, at 0 ms and the delayed stem, height 0.7, at 300 ms. Gain: 2400 notches below 8 kHz, 3.3 Hz apart, too close to draw, so the gain is a band between −10.5 dB and 4.6 dB.

Lesson 220 minYou are hereRead

Audio effects

See a delay effect as a comb, a compressor as a map from level to level, and a reverb as many decaying combs.

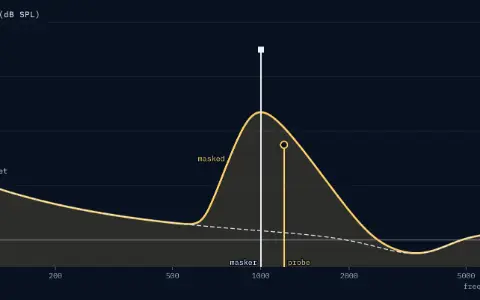
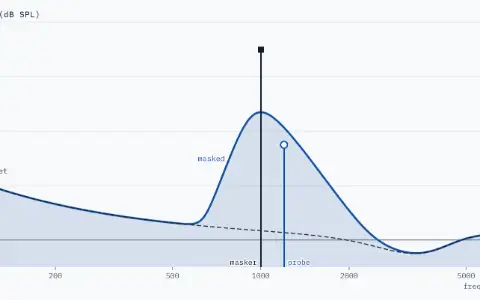
One panel: level from −10 to 80 dB SPL against frequency from 100 to 8000 Hz on a logarithmic scale. The threshold in quiet, a dashed curve labelled in quiet, is 23.0 dB SPL at 100 Hz and lowest near 3.3 kHz. The masked threshold, a solid curve labelled masked with the area under it shaded, peaks at 47.0 dB SPL at the masker; below 637 Hz and above 2467 Hz it follows the threshold in quiet. The masker, a stem with a square head, stands at 1000 Hz and 70 dB SPL. The probe, a stem at 1200 Hz with a round head, open, is at 35.0 dB SPL, 6.3 dB under the masked threshold there, 41.3 dB SPL: masked.One panel: level from −10 to 80 dB SPL against frequency from 100 to 8000 Hz on a logarithmic scale. The threshold in quiet, a dashed curve labelled in quiet, is 23.0 dB SPL at 100 Hz and lowest near 3.3 kHz. The masked threshold, a solid curve labelled masked with the area under it shaded, peaks at 47.0 dB SPL at the masker; below 637 Hz and above 2467 Hz it follows the threshold in quiet. The masker, a stem with a square head, stands at 1000 Hz and 70 dB SPL. The probe, a stem at 1200 Hz with a round head, open, is at 35.0 dB SPL, 6.3 dB under the masked threshold there, 41.3 dB SPL: masked.

Lesson 322 minYou are hereRead

Perceptual audio coding

A loud tone hides quieter ones nearby; MP3 and AAC give each MDCT band just enough bits to keep its noise hidden.

After this chapter

Where to go next.

The chapters either side, and the rest of Part XI in the library.

Phasorium
LibraryEvery lesson, in order

Parts

About Phasorium
Look