Skip to content

Chapter 24

Random signals

Four lessons in Part IX, Random signals and statistical signal processing. Read them in order, or start anywhere: a prerequisite is a link, never a gate.

Start with 24.1
0 of 4 read4 on the essential pathabout 74 minutes

Lessons in this chapter

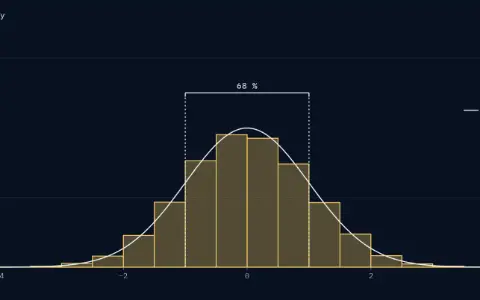
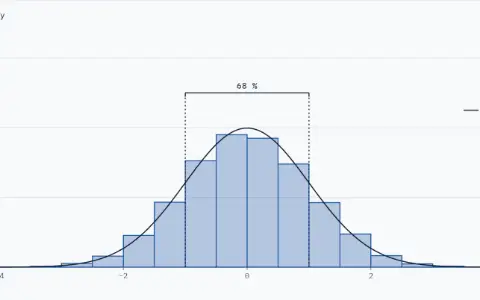
Histogram of 10 000 Gaussian draws in 18 bins 0.5 wide from −4.5 to 4.5, bars scaled as density; the tallest bar is 0.380. A thin solid curve, labelled density, shows the Gaussian density, peak 0.3989 at 0. Dotted lines at −1 and 1 mark the middle 68 %. Mean −0.002, variance 1.027.Histogram of 10 000 Gaussian draws in 18 bins 0.5 wide from −4.5 to 4.5, bars scaled as density; the tallest bar is 0.380. A thin solid curve, labelled density, shows the Gaussian density, peak 0.3989 at 0. Dotted lines at −1 and 1 mark the middle 68 %. Mean −0.002, variance 1.027.

Lesson 1 Essential18 minYou are hereRead

Random variables for signals

Noise has no formula, but its values have a shape: a density, summed up by a mean and a variance; pairs add a correlation.

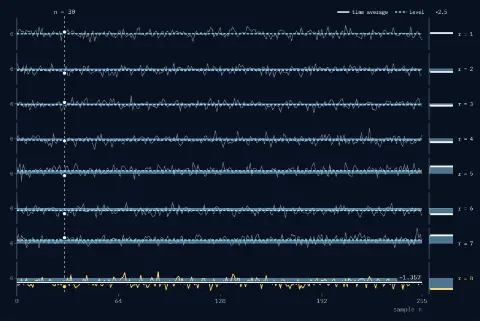
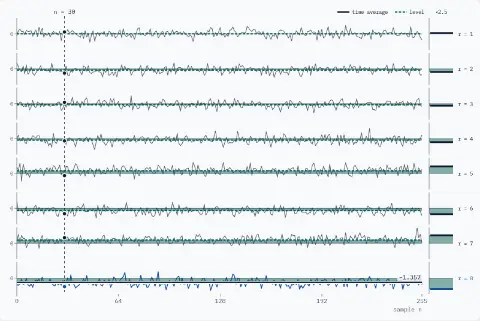
Eight stacked strips, realisations 1 to 8 of 200, each 256 samples over sample n from 0 to 255 and from −5 to 5; realisation 8 is highlighted. A dashed vertical line marks n = 30. Process B: each realisation is the noise plus its own level. Dots mark the eight values at n = 30. A solid line marks realisation 8's own average, −1.357. Beside each strip a short bar shows that realisation's own average, drawn 2.5 times taller: the bars sit at different heights. Dotted lines mark each realisation's level, the band between 0 and the level shaded: the strips sit at different heights; realisation 8's level is −1.422. Readouts: process B: noise + a level; across 200 at n = 30, −0.082; along realisation 8, −1.357.Eight stacked strips, realisations 1 to 8 of 200, each 256 samples over sample n from 0 to 255 and from −5 to 5; realisation 8 is highlighted. A dashed vertical line marks n = 30. Process B: each realisation is the noise plus its own level. Dots mark the eight values at n = 30. A solid line marks realisation 8's own average, −1.357. Beside each strip a short bar shows that realisation's own average, drawn 2.5 times taller: the bars sit at different heights. Dotted lines mark each realisation's level, the band between 0 and the level shaded: the strips sit at different heights; realisation 8's level is −1.422. Readouts: process B: noise + a level; across 200 at n = 30, −0.082; along realisation 8, −1.357.

Lesson 2 Essential16 minYou are hereRead

Random processes

A random signal is one draw from an ensemble. Average across the ensemble or along one recording, and watch white noise forget and coloured noise remember.

Three stacked panels: y[n] as stems with dots, the shifted copy x[n − ℓ] as stems with squares, and R_yx[ℓ] for lags −3 to 5 as stems with diamonds. Lag 5: x is shifted right by 5. Products −1, sum −1. Stems drawn for lags −3 to 5. The peak, 7 at lag 2, is marked.Three stacked panels: y[n] as stems with dots, the shifted copy x[n − ℓ] as stems with squares, and R_yx[ℓ] for lags −3 to 5 as stems with diamonds. Lag 5: x is shifted right by 5. Products −1, sum −1. Stems drawn for lags −3 to 5. The peak, 7 at lag 2, is marked.

Lesson 3 Essential20 minYou are hereRead

Correlation

Slide one signal past another and add the products: the peak gives the delay, and a signal's correlation with itself reveals a hidden period.

Two panels: the autocorrelation R_x[ℓ] as stems for lags −20 to 20, and its DTFT, the PSD S_x in dB against Ω from 0 to π, with a dotted level at 0 dB labelled white. The constant a = 0.90: R_x[ℓ] = 0.90^|ℓ|, and the PSD is 12.8 dB at Ω = 0 and −12.8 dB at Ω = π.Two panels: the autocorrelation R_x[ℓ] as stems for lags −20 to 20, and its DTFT, the PSD S_x in dB against Ω from 0 to π, with a dotted level at 0 dB labelled white. The constant a = 0.90: R_x[ℓ] = 0.90^|ℓ|, and the PSD is 12.8 dB at Ω = 0 and −12.8 dB at Ω = π.

Lesson 4 Essential20 minYou are hereRead

Power spectral density

See how a random signal's power spreads over frequency: the DTFT of its autocorrelation, reshaped by a filter's gain squared into pink or brown noise.

Phasorium
LibraryEvery lesson, in order

Parts

About Phasorium
Look