Skip to content

Statistics

Time series

A time series is a sequence of measurements in which each value depends on the ones before it. This topic measures that dependence with autocorrelation, forecasts with autoregressive models, and separates trend and season by smoothing.

Lessons on this topic

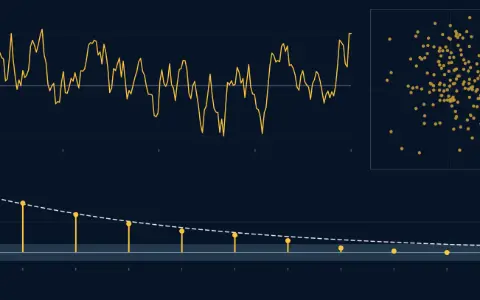
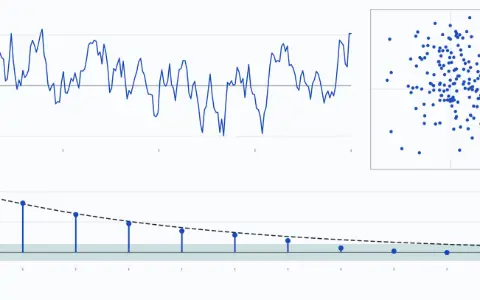
Left: a series of 200 values that wanders slowly around 0. Right: its lag plot at lag 10, each value against the value 10 steps later; correlation −0.0034. Below: the measured autocorrelation at lags 1 to 10 as dots over the curve 0.8 to the power of the lag, and a band of ±0.139.Left: a series of 200 values that wanders slowly around 0. Right: its lag plot at lag 10, each value against the value 10 steps later; correlation −0.0034. Below: the measured autocorrelation at lags 1 to 10 as dots over the curve 0.8 to the power of the lag, and a band of ±0.139.

Advanced · 30 minYou are hereRead

Time series and autocorrelation

A series remembers its past; plot it against a shifted copy of itself, and the correlation of that cloud, lag by lag, is its autocorrelation.

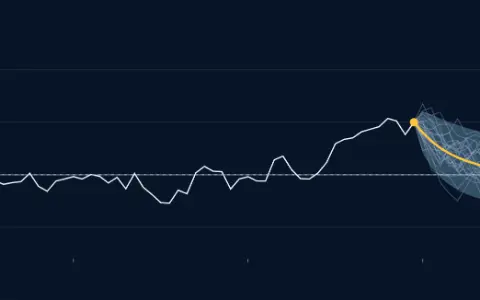
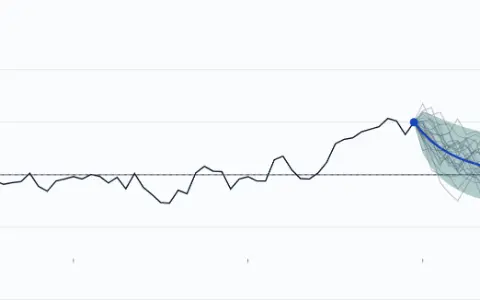
100 values of a series that ends at 5, above its mean of 0. A forecast line decays from 5 towards 0 over 20 steps, with a shaded 95 % interval opening around it to a half-width of 3.27. Faint simulated futures spread through the fan; 95.7 % of their points fall inside.100 values of a series that ends at 5, above its mean of 0. A forecast line decays from 5 towards 0 over 20 steps, with a shaded 95 % interval opening around it to a half-width of 3.27. Faint simulated futures spread through the fan; 95.7 % of their points fall inside.

Advanced · 30 minYou are hereRead

Autoregressive models and forecasting

Today’s value is a weighted sum of earlier values plus fresh noise; forecasts lean back to the mean while their uncertainty fans out.

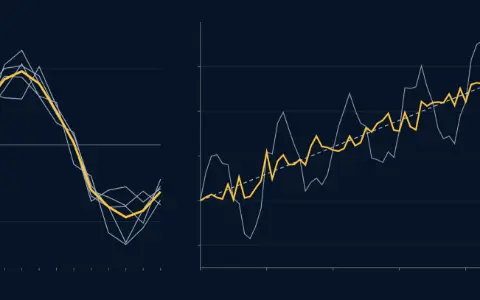
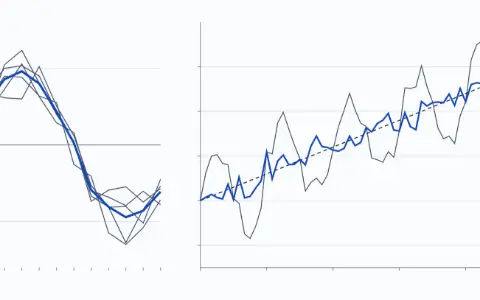
Top: 5 years of monthly values with the rise removed, laid over January to December. A thick curve, their average: the seasonal profile, 0.580 from the true cycle. Bottom: the series and, after subtracting the profile, the adjusted series, a rising line with noise.Top: 5 years of monthly values with the rise removed, laid over January to December. A thick curve, their average: the seasonal profile, 0.580 from the true cycle. Bottom: the series and, after subtracting the profile, the adjusted series, a rising line with noise.

Advanced · 30 minYou are hereRead

Smoothing and seasonality

Averaging neighbours removes noise at the price of lag and blur, and averaging month by month finds a seasonal pattern that can be subtracted.

Related topics

Where to go next.

Phasorium

Account

Sign inKeep your place on any device

Subjects

Site

Look