Skip to content

Statistics

Regression

Regression fits a line, or a curve, through data to predict one quantity from another. This topic fits lines by least squares, explains regression to the mean, and shows how a model with too many parameters fits noise instead of signal.

Lessons on this topic

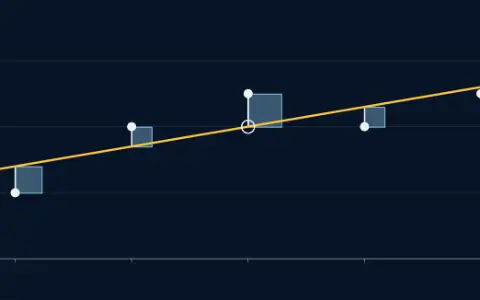
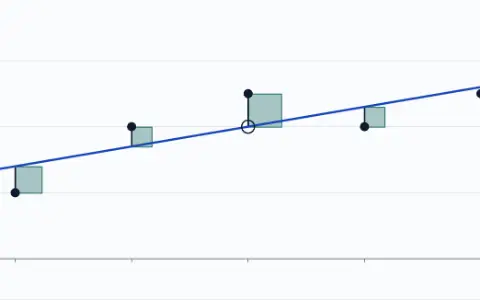
Five points at (1, 2), (2, 4), (3, 5), (4, 4) and (5, 5), and the line y = 2.20 + 0.60x. Each vertical gap from a point to the line is the side of a square; the five squares add to 2.40.Five points at (1, 2), (2, 4), (3, 5), (4, 4) and (5, 5), and the line y = 2.20 + 0.60x. Each vertical gap from a point to the line is the side of a square; the five squares add to 2.40.

Intermediate · 30 minYou are hereRead

Linear regression

The least-squares line makes the total area of the residual squares smallest; its slope is the correlation times a ratio of spreads.

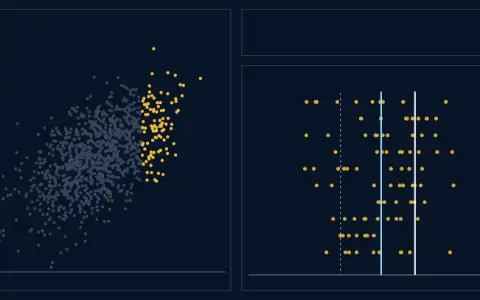
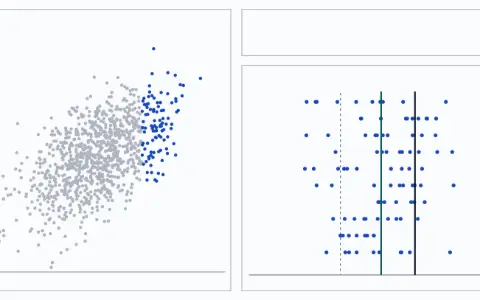
Three panels. The population: two tests with mean 500 and standard deviation 100 each, correlation 0.60. 1000 students as dots, test 1 across and test 2 up, the top tenth on test 1 lit. The lit group on one axis: their test-1 mean 662.8, their test-2 mean 588.9.Three panels. The population: two tests with mean 500 and standard deviation 100 each, correlation 0.60. 1000 students as dots, test 1 across and test 2 up, the top tenth on test 1 lit. The lit group on one axis: their test-1 mean 662.8, their test-2 mean 588.9.

Intermediate · 25 minYou are hereRead

Regression to the mean

The best guess for a retest lies between the first score and the average, so extreme performers drift back with no cause at all.

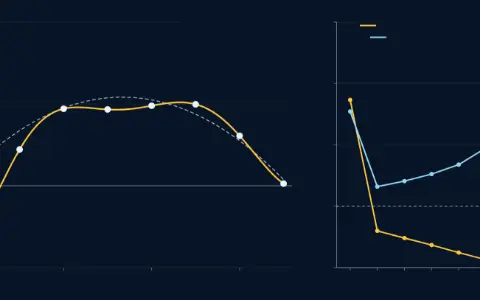
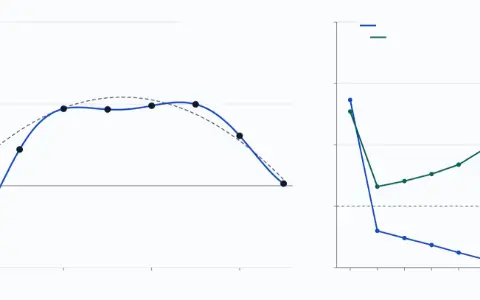
Top: eight training points from a parabola plus noise. A fitted polynomial of degree 7. Bottom: the training error and the error on 200 new points, each averaged over 200 datasets, against the degree, traced from 1 to 7: now 0.0000 and 0.7846.Top: eight training points from a parabola plus noise. A fitted polynomial of degree 7. Bottom: the training error and the error on 200 new points, each averaged over 200 datasets, against the degree, traced from 1 to 7: now 0.0000 and 0.7846.

Advanced · 30 minYou are hereRead

Overfitting and model choice

A flexible curve can pass through every training point and still predict new points badly; hold some data back, or charge a price for complexity.

Phasorium

Account

Sign inKeep your place on any device

Subjects

Site

Look