Skip to content

Statistics

Hypothesis tests

A hypothesis test asks whether data are surprising under a default assumption. This topic sets up significance tests, reads p-values with care, compares means with t-tests, and compares counts with chi-square tests.

Lessons on this topic

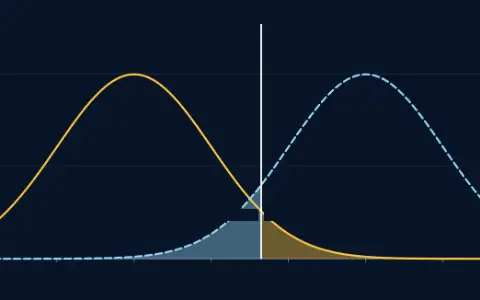
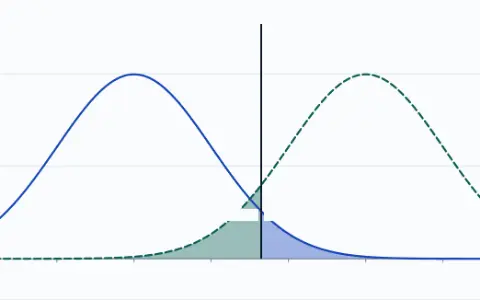
Two bells of the same width on one axis: A, no effect, centred on 0; B, effect, centred on 3. A threshold line at 1.645; the area of A to its right is shaded as false alarms, 0.0500; the area of B to its left as misses, 0.0877.Two bells of the same width on one axis: A, no effect, centred on 0; B, effect, centred on 3. A threshold line at 1.645; the area of A to its right is shaded as false alarms, 0.0500; the area of B to its left as misses, 0.0877.

Intermediate · 30 minYou are hereRead

Significance tests

A test fixes a threshold before looking; moving it trades false alarms against misses, and only a bigger effect or more data cuts both.

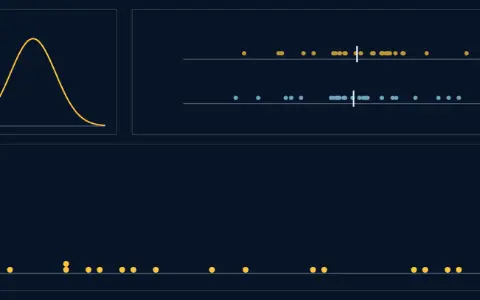
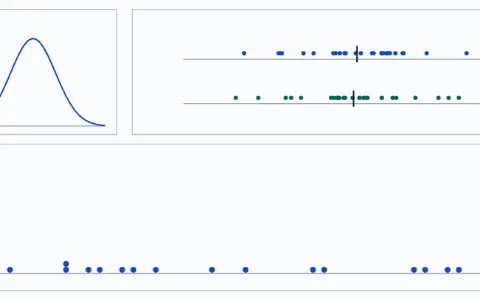
Three panels. The population of studies: pill and placebo values come from the same bell. One study, number 20: two rows of 30 dots and their means; p-value 0.812. The p-values: 20 dots on a line from 0 to 1, the stretch below 0.05 shaded; 1 fall in it. A second line at 0.0025, Bonferroni's cut.Three panels. The population of studies: pill and placebo values come from the same bell. One study, number 20: two rows of 30 dots and their means; p-value 0.812. The p-values: 20 dots on a line from 0 to 1, the stretch below 0.05 shaded; 1 fall in it. A second line at 0.0025, Bonferroni's cut.

Intermediate · 30 minYou are hereRead

p-values

A p-value says how surprising the data would be if nothing were going on; it is not the chance that nothing is going on.

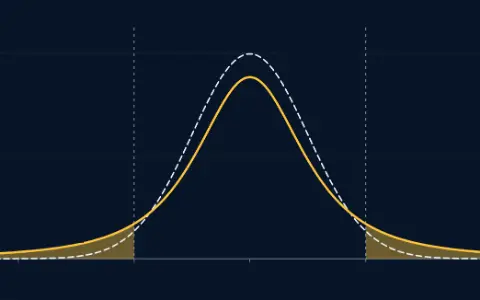
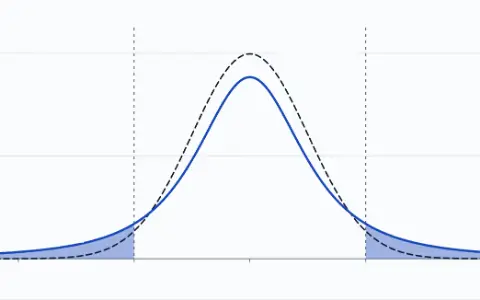
The standard bell, dashed, and the t curve with 2 degrees of freedom, solid, on an axis from −6 to 6. The t curve's area beyond −2 and 2 is shaded: 0.1835; the bell's is 0.0455.The standard bell, dashed, and the t curve with 2 degrees of freedom, solid, on an axis from −6 to 6. The t curve's area beyond −2 and 2 is shaded: 0.1835; the bell's is 0.0455.

Intermediate · 30 minYou are hereRead

t-tests

With a spread estimated from a small sample, the standardised mean has heavier tails than the bell, and pairing data can beat adding data.

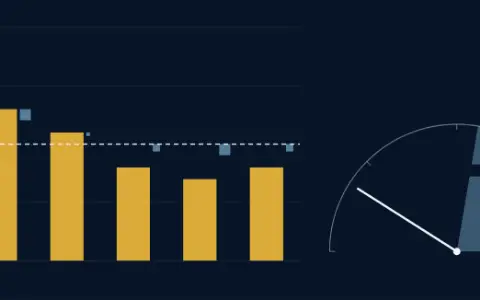
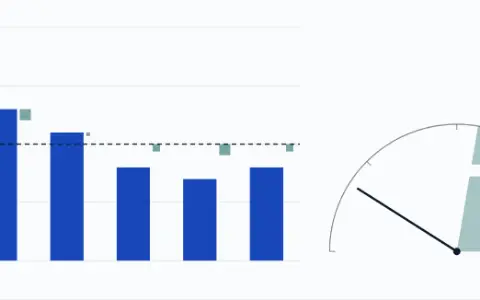
Six bars, the counts of each face after 60 rolls of the fair die: 13, 13, 11, 8, 7 and 8, against a level line at 10. Squares on the bars add into a needle at 3.60 on a dial shaded from 11.07.Six bars, the counts of each face after 60 rolls of the fair die: 13, 13, 11, 8, 7 and 8, against a level line at 10. Squares on the bars add into a needle at 3.60 on a dial shaded from 11.07.

Intermediate · 30 minYou are hereRead

Chi-square tests

Add up the squared gaps between counts seen and counts expected, each scaled by its expected count; a fair die rarely adds up to much.

Phasorium

Account

Sign inKeep your place on any device

Subjects

Site

Look