Skip to content

Statistics

Estimation

Statistics works backwards from data to the process that made it. This topic summarises data, judges an estimator by its bias and variance, fits parameters by maximum likelihood, and states the uncertainty with confidence intervals and the bootstrap.

Lessons on this topic

Nine values on a line from 0 to 125 ms: 12, 14, 15, 15, 16, 18, 19, 21, 95. The mean marker is at 25.00 and the median marker at 16. A box plot from 15 to 19 with whiskers to 12 and 21, and 95 marked as an outlier.Nine values on a line from 0 to 125 ms: 12, 14, 15, 15, 16, 18, 19, 21, 95. The mean marker is at 25.00 and the median marker at 16. A box plot from 15 to 19 with whiskers to 12 and 21, and 95 marked as an outlier.

Beginner · 30 minYou are hereRead

Describing data

One far point drags the mean but barely moves the median, so choose the summary that fits the data, and read its shape first.

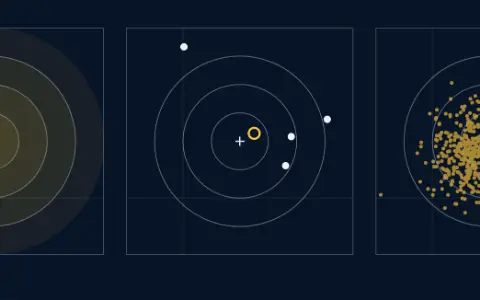
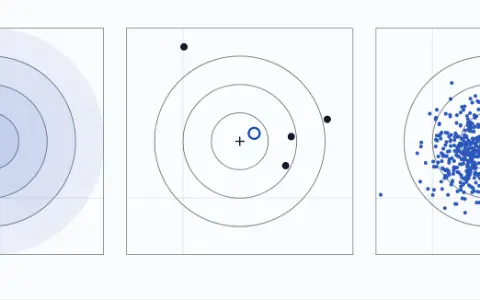
Three panels. The population: a round bell centred on a bull's-eye at (1, 1). One sample: 4 points and the estimate made from them. 500 repeats: 500 shots, each 0.80 times a sample's average, around the bull's-eye. Bias squared 0.0831, variance 0.3381, mean squared distance 0.4212.Three panels. The population: a round bell centred on a bull's-eye at (1, 1). One sample: 4 points and the estimate made from them. 500 repeats: 500 shots, each 0.80 times a sample's average, around the bull's-eye. Bias squared 0.0831, variance 0.3381, mean squared distance 0.4212.

Intermediate · 35 minYou are hereRead

Estimators: bias and variance

An estimate is one draw of a random variable, and the best estimator can trade a little off-centre for a lot less scatter.

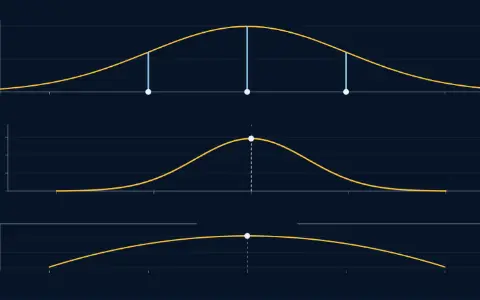
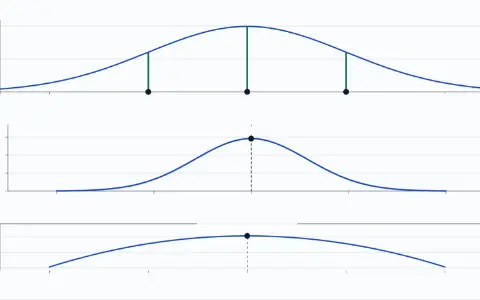
Top: the data 3, 5 and 7 on an axis, and a bell with spread 2 centred at 5.0, with a stem from each point up to the bell. Middle: the likelihood against the centre μ, traced from 1 to 9.0; at 5.0 it is 0.00292. Bottom: its logarithm, a downward parabola. The peak, 0.00292 at μ = 5, is marked.Top: the data 3, 5 and 7 on an axis, and a bell with spread 2 centred at 5.0, with a stem from each point up to the bell. Middle: the likelihood against the centre μ, traced from 1 to 9.0; at 5.0 it is 0.00292. Bottom: its logarithm, a downward parabola. The peak, 0.00292 at μ = 5, is marked.

Intermediate · 30 minYou are hereRead

Maximum likelihood

Pick the parameter that makes the data you saw most probable, by sliding the model until its curve fits the points best.

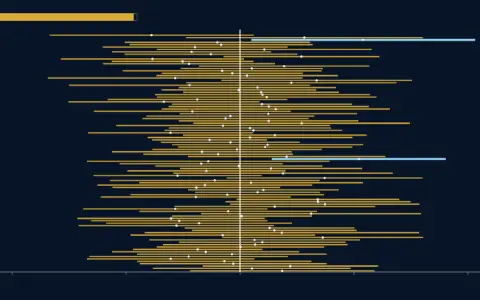
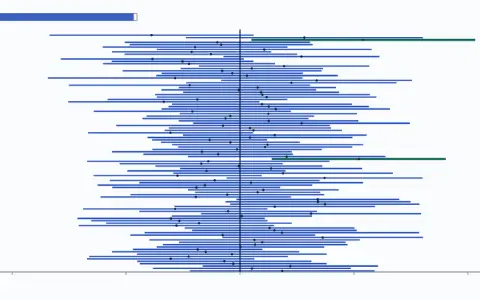
A vertical line marks the true mean, 10, on an axis from 7.5 to 12.5. 100 rows, each a sample's 95 % interval as a bar with a dot at its mean: 98 cross the line, 2 miss it and are drawn in a second colour.A vertical line marks the true mean, 10, on an axis from 7.5 to 12.5. 100 rows, each a sample's 95 % interval as a bar with a dot at its mean: 98 cross the line, 2 miss it and are drawn in a second colour.

Intermediate · 35 minYou are hereRead

Confidence intervals

An interval built from a sample catches the true value in about 95 of every 100 samples; the true value never moves, the intervals do.

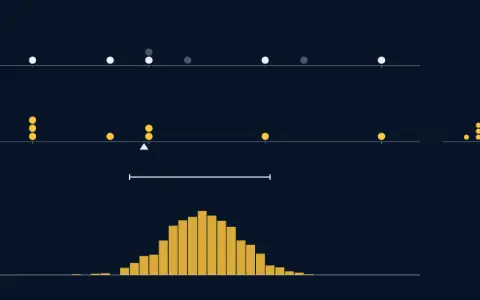
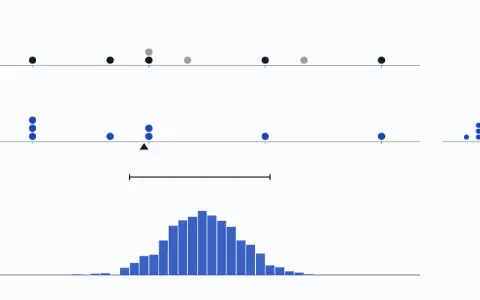
Three panels. The one sample we have: 12, 14, 15, 15, 16, 18, 19 and 21 ms. One resample: 15, 18, 12, 15, 21, 14, 12, 12; the sample values it missed are greyed out. Means of many resamples: a histogram of 1000 means, spread 0.9326.Three panels. The one sample we have: 12, 14, 15, 15, 16, 18, 19 and 21 ms. One resample: 15, 18, 12, 15, 21, 14, 12, 12; the sample values it missed are greyed out. Means of many resamples: a histogram of 1000 means, spread 0.9326.

Intermediate · 25 minYou are hereRead

The bootstrap

Resample your one sample with replacement to see how much a statistic would wobble, with no formula needed.

Phasorium

Account

Sign inKeep your place on any device

Subjects

Site

Look