Skip to content

Probability

Several random variables

Two random quantities measured together have a joint distribution. This topic reads joint and marginal distributions, measures how two variables move together with covariance and correlation, adds random variables, and uses generating functions to do the sums.

Lessons on this topic

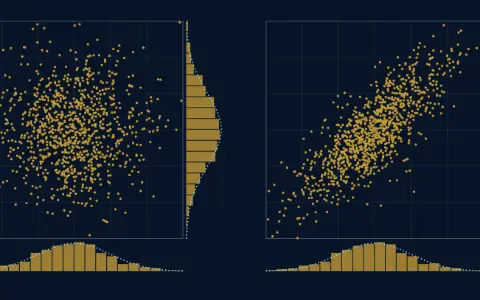
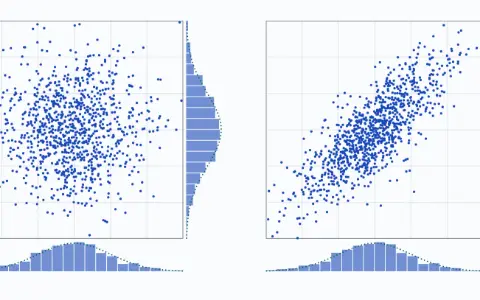
Two clouds of 1000 points on axes from −3 to 3: the left one round, the right one tilted up to the right. Histograms along the edges show the first numbers below each cloud and the second numbers beside it. A dotted standard bell is drawn over each edge histogram.Two clouds of 1000 points on axes from −3 to 3: the left one round, the right one tilted up to the right. Histograms along the edges show the first numbers below each cloud and the second numbers beside it. A dotted standard bell is drawn over each edge histogram.

Intermediate · 30 minYou are hereRead

Joint distributions

See two variables together as a cloud, its shadows on the axes as the marginals, and a slice through it as a conditional distribution.

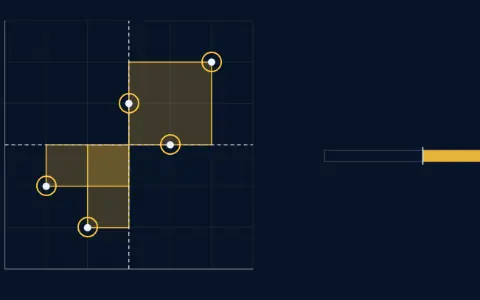
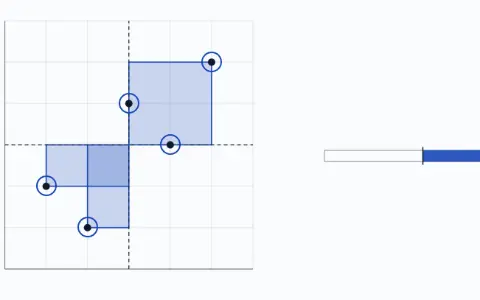
Five points on a grid from 0 to 6: (1, 2), (2, 1), (3, 4), (4, 3), (5, 5). Dashed lines at the means, 3.0 across and 3.0 up, cut the plane into four quadrants. Rectangles from the points to the crossing: top right and bottom left shaded positive, the other two negative; their signed areas add to 8.00.Five points on a grid from 0 to 6: (1, 2), (2, 1), (3, 4), (4, 3), (5, 5). Dashed lines at the means, 3.0 across and 3.0 up, cut the plane into four quadrants. Rectangles from the points to the crossing: top right and bottom left shaded positive, the other two negative; their signed areas add to 8.00.

Intermediate · 30 minYou are hereRead

Covariance and correlation

Add up signed rectangles around the means to see whether two things rise together, then scale the sum into a correlation between −1 and 1.

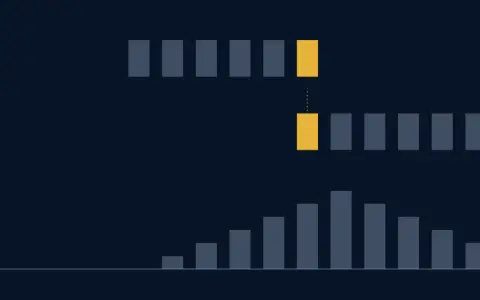
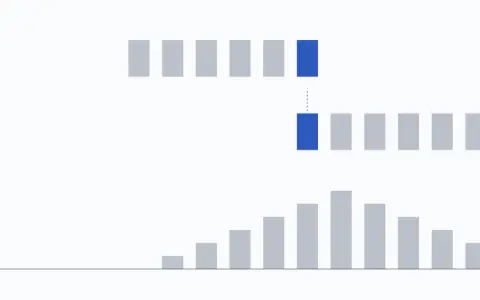
Top row: one die, six bars of 1/6 over the faces 1 to 6. Middle row: the other die turned round. It sits at total 12: 1 pairs of bars line up and are lit. Bottom row, the chances of the totals so far: 2: 1/36, 3: 2/36, 4: 3/36, 5: 4/36, 6: 5/36, 7: 6/36, 8: 5/36, 9: 4/36, 10: 3/36, 11: 2/36, 12: 1/36.Top row: one die, six bars of 1/6 over the faces 1 to 6. Middle row: the other die turned round. It sits at total 12: 1 pairs of bars line up and are lit. Bottom row, the chances of the totals so far: 2: 1/36, 3: 2/36, 4: 3/36, 5: 4/36, 6: 5/36, 7: 6/36, 8: 5/36, 9: 4/36, 10: 3/36, 11: 2/36, 12: 1/36.

Intermediate · 30 minYou are hereRead

Sums of random variables

Slide one die’s chances across the other’s to build the triangle of a two-dice total, and see why spreads add as squares, not directly.

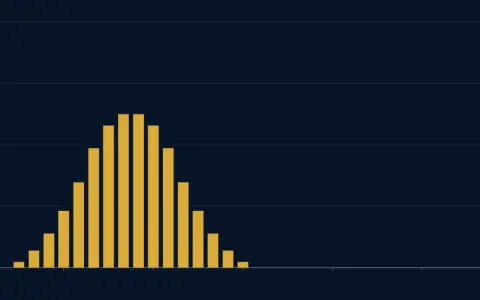
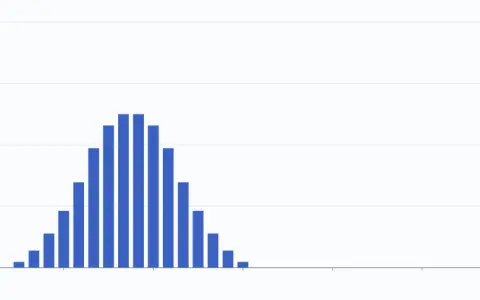
Bars of the numbers of the polynomial for 3 dice, one for each power of z from 3 to 18. The tallest is 0.1250. Mean 10.5, variance 8.7500.Bars of the numbers of the polynomial for 3 dice, one for each power of z from 3 to 18. The tallest is 0.1250. Mean 10.5, variance 8.7500.

Advanced · 30 minYou are hereRead

Generating functions

Write a die’s chances as a polynomial, multiply two of them to add two dice, and read the mean and variance from derivatives.

Phasorium

Account

Sign inKeep your place on any device

Subjects

Site

Look