Skip to content

Probability

Limit theorems

Averages of many independent draws settle near the expected value, and their spread around it takes the shape of a bell. This topic shows the law of large numbers and the central limit theorem, and says when each one holds.

Lessons on this topic

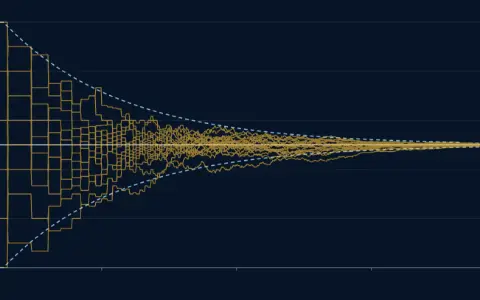
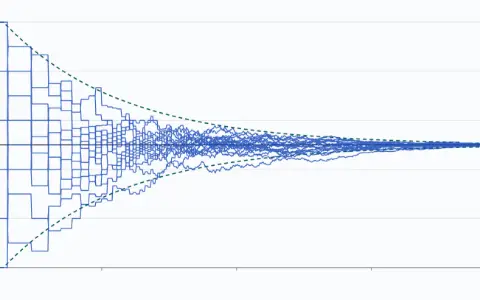
Twenty paths of running averages of die rolls against the number of rolls, 1 to 10 000 on a log axis, drawn up to 10 000 rolls. A line marks the mean 3.5, and a dashed funnel 3.5 ± 2σ/√n narrows around it.Twenty paths of running averages of die rolls against the number of rolls, 1 to 10 000 on a log axis, drawn up to 10 000 rolls. A line marks the mean 3.5, and a dashed funnel 3.5 ± 2σ/√n narrows around it.

Intermediate · 30 minYou are hereRead

The law of large numbers

Watch twenty running averages of die rolls settle on 3.5 inside a narrowing funnel, and see why a streak never has to be paid back.

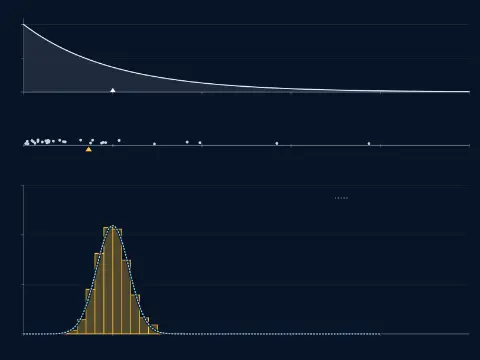
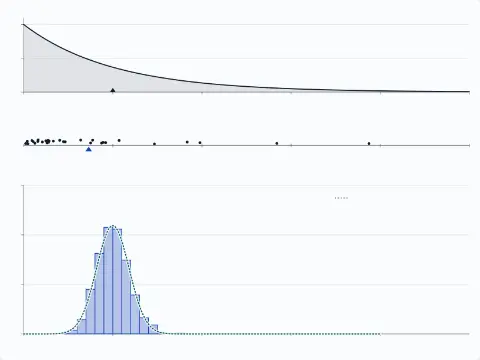
Three panels on one horizontal scale from 0 to 5. Top, every draw: the lopsided density e^(−x) of a single draw, highest at 0, with its mean 1 marked by a triangle. Middle, one sample of 30: 30 draws as dots, their mean 0.730 marked by a triangle. Bottom, the averages: 2000 of 2000 averages of 30 in bars 0.1 wide from 0 to 4, scaled as density; the tallest bar is 2.150, from 0.9 to 1.0. A dotted bell with the same centre and spread, 1 and 0.183, is drawn over the pile. Measured spread of the averages 0.183; predicted, 1/√n, 0.183; 0 off the scale.Three panels on one horizontal scale from 0 to 5. Top, every draw: the lopsided density e^(−x) of a single draw, highest at 0, with its mean 1 marked by a triangle. Middle, one sample of 30: 30 draws as dots, their mean 0.730 marked by a triangle. Bottom, the averages: 2000 of 2000 averages of 30 in bars 0.1 wide from 0 to 4, scaled as density; the tallest bar is 2.150, from 0.9 to 1.0. A dotted bell with the same centre and spread, 1 and 0.183, is drawn over the pile. Measured spread of the averages 0.183; predicted, 1/√n, 0.183; 0 off the scale.

Intermediate · 35 minYou are hereRead

The central limit theorem

Average enough draws from a lopsided shape and the averages pile into a bell around the mean, narrowing as the square root of n grows.

Phasorium

Account

Sign inKeep your place on any device

Subjects

Site

Look